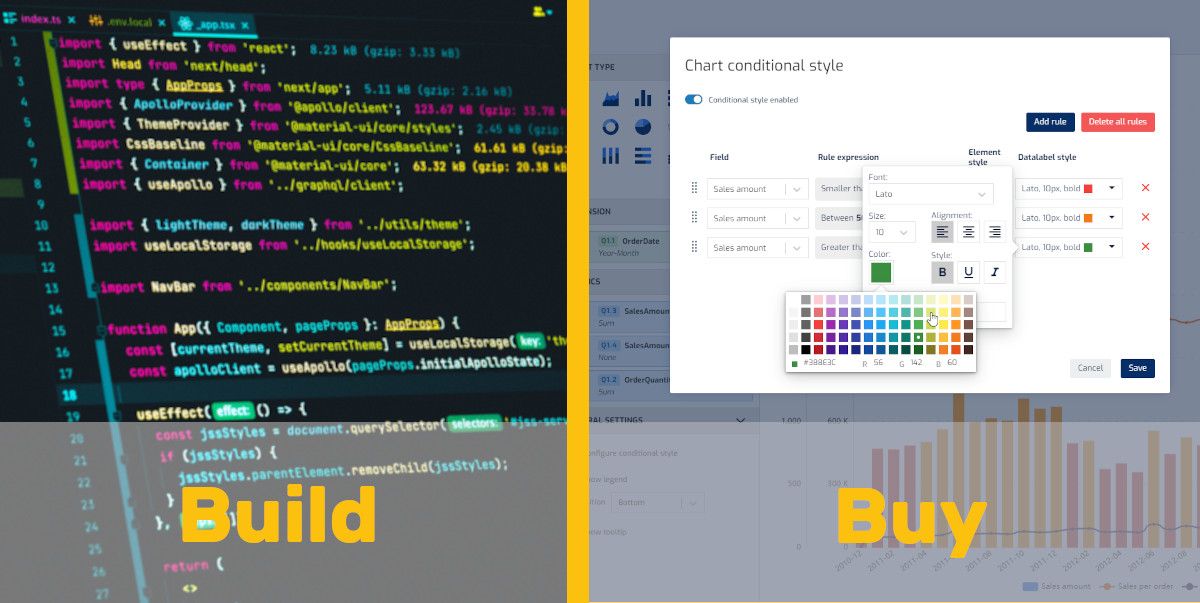
Data Analytics in my application: should I build or buy?
Imagine you are in charge of a company running a software platform in the UK and you want your users to have the best data analytics experience within your app as possible. What can you do? You have several options, but the two most used or most obvious are: internal development or purchasing specific software. In this article we explain this topic in more detail, hoping that you have all the information to make the right decisions at all times.
In this article we explain the different alternatives you have, with their pros and cons, as a general, technical or product manager of a company that has a software tool that is considering starting or improving a section that provides enormous added value to your application, the ability to visualize data and interactive analysis, so that your users can take valuable actions when using your application.
To do this, we are going to imagine a specific application case, so that the different steps are understood. Let's imagine that your company develops and offers logistics management software, through a modern web application.
Searching for information
If you are reading this article, you are on the right track, because almost the first thing you can do is inform yourself well through various means about what options there are, what advantages and disadvantages each one has, what other companies do, what aspects you have to take into account. in each case, what you will have to face, etc.
Normally we use search engines to inform ourselves about different areas and for this, you could launch some searches on the following topics:
- Logistics Analytics. The term analytics applied to your vertical is an open search with which you can start to obtain various resources on data analytics applied to your specific sector.
- Data Visualization. Since at the end of the day the final result that your user will consume is made up of data visualizations with different formats and utilities, this is an important point.
- Dashboard Design. One of the common formats is to offer users data panels that in one way or another must be designed. There are no fixed rules in this regard but you probably need to have ideas, some examples with which you can be inspired. By the way, we recommend using a spectacular site like Dribbble.
- KPIs for Logistics. Applied to your own software, you must be clear about the key indicators or KPIs, how they are defined, how they are calculated, and how users should interpret them. Each vertical, each sector, each application, has its own characteristics and therefore, will have its own KPIs.
- Business Intelligence Tools. To have a market reference, it is advisable to find out about the available tools, which are many, verifying that they are specialists to help manage the life cycle of a data analytics solution, integrated in this case into your own software. Above all, you must identify those that fit your company, your software and its vision of the future.
- Real-time Analytics. Certain verticals, such as this example, logistics, have special requirements for delivering data to users, such as the ability to analyze data in real time.
- Predictive Analytics. Another important aspect is to inform yourself about the predictive capabilities (obtaining future values based on past values, other data sets and certain parameterizations) that the tools can provide, whether it is an internal development in your company or a functionality offered by third-party software.
- Data Integration. One of the points that must be faced when offering an analytical layer in your software is to prepare the data appropriately, with all the possible casuistries of each case (cleaning, filtering, unification, aggregation, etc.).
- User Experience (UX) in Dashboards. You must keep in mind the resources necessary to create fluid and intuitive user experiences in your data dashboards.
- Case Studies in Logistics Analytics. Finally, it is advisable to know how others have done it, what use cases are available to know what problems they faced, what tools they used, the recommendations they collected, etc.
Weighing options
When you know the terminology involved in offering a high-value layer to your users, such as data analytics, you begin to have the knowledge necessary to make decisions.
Honestly, no two cases are the same, even the same company goes through different moments in its life, from very initial stages to very advanced stages. However, the great options to consider are the following:
- Develop the solution in-house. For a company that develops software, perhaps this is the first option that crosses your mind, that is, developing and maintaining the data analysis solution internally.
- Buy the solution. There is a specific category of software available on the market, known as “Embedded Analytics” software that, in a simplified way, allows you to build and maintain the different dashboards and integrate them into your own software.
- A hybrid approach. Hybrid approaches that use the best points of each of the previous options can also be considered.
1. Develop a Data Analytics solution in-house
The first thing is to know what this means. As we said, in a software development company, the first tendency is to treat data analytics as if it were just another part of the product or platform, and try to develop it with the same team, but it is important to know all the implications, it's not about starting to code and see what comes out.
If you apply logic, several questions will come to mind.
Could I build a Data Analytics solution for my product?
The most common answer for this question if asked from the technical or product side is yes. It is an understandable first thought. Many product leaders have a specific vision for their solution and initially do not believe that a third-party application can meet their needs easily, quickly and with an adequate ROI.
Inevitably, it is common for technology and product teams to immediately start thinking about programming in the same language that the application uses, using pre-built templates, using component and chart libraries, etc. However, this “do it myself” mentality inevitably leads to long-term challenges, including some that are not initially obvious.
In other words, it can often be a mistake to think that it is only about programming or applying a design, since there are many previous and subsequent aspects, intrinsic to the data and how users are going to experience the discovery of the information, inside your application. Usually to build a data analysis solution, no matter how simple it is (and it will get complicated), specialists in data management, preparation, visualization, etc. are needed on the team.
Our experience in the sector tells us that many have tried, but few have succeeded. Creating a properly functioning data analytics solution from scratch is a complex task that can take years to perfect. In addition to the advanced data expertise and technical integration required, building your own solution in-house means you need to consider all of the following factors:
- Recruit the skills necessary for implementation and cover the cost of that investment.
- Dedicate all necessary resources to make data analytics functionality simply work (including support, maintenance, and updates).
- Ensure UX consistency with the main application.
Most importantly, the decision to create your own data analysis tool means that you will compete with the analytical functions of specialized Embedded Analytics solutions. This is an extremely difficult task.
What specific aspects of Business Intelligence should I take into account?
As we said, it's not just about programming and that's it. There are quite a few points to keep in mind that the internal team (current or hired) must address. The first aspect is related to knowledge about data management, preparation and assembly. Here's a fact: there are truly few people who UNDERSTAND DATA. You have to know how to interpret the data, understand how it is stored, know how it is related, where it is and where it has to go, how it is consulted, who can see it and who cannot, how any element is modified, etc. All of these issues fall into the realm of data engineering.
In any case it is necessary:
- Manage complex data quickly, likely to be large and disparate data sets.
- Share data and information securely at scale. Should we provide concurrent service to 100 users, to 2000 users?
- Ensure that the solution uses a low-cost, scalable infrastructure.
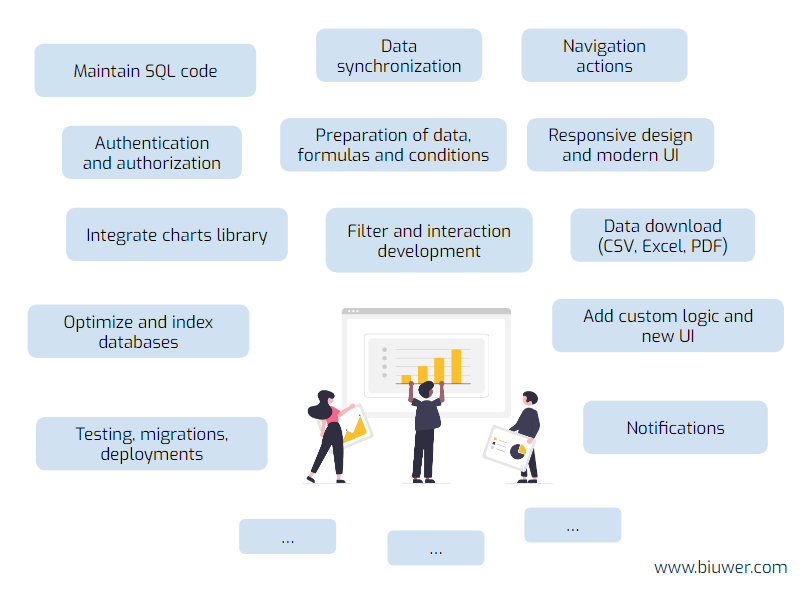
You should also take into account how to solve aspects such as:
- Maintain SQL code.
- Data synchronization.
- Navigation actions.
- Authentication (who the user is) and authorization (what they can do).
- Integrate charts library.
- Integrate maps library.
- Integrate table components.
- Preparation of data, formulas and conditions.
- Responsive design with modern UI/UX.
- Development of filters and interactions.
- Download data in different formats (CSV, Excel, PDF, image).
- Optimize and index databases.
- Add custom logic and new UI.
- Testing, migrations, deployments between environments.
- Develop a notification system.
And many other more or less complex aspects that depend on each specific project. Surely if you continue asking yourself along these lines you will get more points to take into account.
How long will it take me to build the first version? And each modification?
Usually, the implementation time of the first version is taken into account, which is usually a starting point, which must be continually evolving in parallel with how your application evolves. That is to say, the reality of a data analytics solution is that it will have multiple evolutions, which is totally normal and recommended, to include functional and format improvements, providing more and more value to users.
If I had to make a big bet now, I would say that the weight of the medium and long-term evolutions will end up being several times the weight of the initial development. When we talk about weight, in the end it means hours of work that cost money.
The development from scratch of a more or less complete solution of dashboards with KPIs, charts, tables and some interactions (filters, data export) can range from a few months to many months (more than a year), depending on the complexity. of the data, the experience of the team that develops it and the scope to be developed.
How much will the first version cost financially? And each modification?
In parallel with the previous point, depending on the team you have internally or outsourced, it is important to evaluate the cost of developing an initial version, which based on experience will be changed several times over time. The economic cost can be done by evaluating the ROI (Return on Investment) at different levels with some tools.
What is the opportunity cost?
Additionally, you should take into account the opportunity cost, that is, all the time and financial resources that are being dedicated to developing and maintaining a data analysis tool are not being dedicated to evolving the main product, that is, your application. It is about focusing on what is considered important, with the resources available.
2. Buy an Embedded Analytics solution
Data Analytics tools that allow you to fully integrate with your logistics application are called Embedded Analytics. These are tools that can be used initially for internal use in your company, while you carry out testing and integration, but they are platforms created specifically to be used in an integrated way.
Embedded Analytics platforms, at least the most powerful ones, do much of the dirty work related to all of the activities listed above. Ideally, they are cloud tools that can be used by various users in your company to connect, model and create the data visualizations necessary to show the KPIs relevant to your product and your users, in various ways, usually through dashboards or interactive panels using dynamic filters, which contain numerical indicators, charts of various types, tables of various formats, maps and other visual elements that provide more personalization to the result (rich texts, images, buttons, separators, etc.).
Selecting an Embedded Analytics platform is an important decision, for which you must take into account multiple factors such as:
- Available data connectors and types of data management (direct connection, cached data, hybrid, etc.).
- Data modeling capabilities, definition of formulas and calculations.
- Scalable infrastructure for thousands of users.
- Authorization of access to content and data, through data policies that guarantee row-level access to the data. A dashboard for all users, each one sees their data.
- Flexibility for content composition, application of filters.
- Integration capabilities with your application.
- Automation capabilities through APIs.
- Style customization capabilities, selection of styles and colors for various graphic elements.
- Multi-language content management capabilities, to support SaaS applications with users from different countries.
- Interactive capabilities to promote dynamism in data panels, empowering users to ask as many questions as they deem necessary to understand the information and make accurate decisions. We know this as actionable data.
- Configuration through complete user interfaces but at the same time intuitive and easy to use. No-Code platforms are imposed, so that users can use them without the need for technical knowledge (SQL, Python, etc.).
- Audit and usage control system, to evolve the data analytics product and your own software, in an informed manner.
As you can understand, an Embedded Analytics platform with these characteristics implies several years of experience, development and continuous improvement, with countless details designed to improve usability and super fast operation, which is difficult to achieve internally in different projects.
3. A hybrid approach to delivering Data Analytics to my users
A hybrid approach involves combining elements of both building an in-house solution and purchasing a third-party Embedded Analytics solution to strike a balance between customization and speed to market. Below is a more detailed explanation of how a hybrid approach can be implemented:
- Start with an Embedded Analytics platform. Start by selecting an integrated analytics solution from a trusted vendor that aligns with the immediate needs of your company and application. This way you can quickly integrate dashboards and data visualizations into your logistics software. You should look for a solution that offers at least basic analytics capabilities and is easy to configure.
- Do a quick implementation. Deploy the Embedded Analytics platform to provide your users with basic analytics functionality as quickly as possible. This allows you to address the immediate demand for analytics dashboards without investing a lot of time and resources into building a custom solution from scratch.
- Collect feedback and evaluate your users. Ask for and collect user feedback on the offered solution. It is important to understand their needs and preferences in terms of data visualization, features, and usability. These comments can guide you in the process of iterations on the Embedded Analytics tool and in a decision-making process about its suitability or not, to address personalized requirements.
- Identify customization requirements. Analyze the feedback and evaluate whether there are specific customization requirements or advanced features that your users need but are not adequately addressed by the Embedded Analytics solution. Identify the differences between what your users expect and what the chosen Embedded Analytics platform offers.
- Gradual customization. Based on feedback and identified gaps, gradually begin creating custom analytics features and internal improvements. Prioritize the development of features that provide a competitive advantage or are critical to your users. At the end of the day, it is about using data analytics to position your product or application distinctively, being an important purchasing criterion. Also for your current clients and users, it is about monetizing plans with greater functionalities, such as data analytics.
- **Integration and data flow. Ensure that custom analytics components integrate seamlessly with the Embedded Analytics platform and that data flows seamlessly between them. Data synchronization and consistency are key.
- Iterative development. Implements an iterative development process, regularly releasing updates and improvements to analytics dashboards based on user feedback and evolving business needs.
- Manage costs. Be aware of the costs associated with both subscribing to the Embedded Analytics platform and internal development. Evaluate whether the benefits of customization outweigh the expenses.
- Data security and compliance. Regularly monitor data security and compliance as custom components are introduced. Ensure that all data management and storage practices meet regulatory requirements and user expectations.
- Long term strategy. Develop a long-term strategy for your hybrid approach. Determine when and how you might transition more components to in-house development, based on the growth and success of your app and company.
By following this hybrid approach, you can quickly meet your users' initial analytics needs while retaining the flexibility to customize and improve the solution over time. This approach allows you to achieve a balance between speed, profitability and customization, ultimately improving the competitiveness of your logistics software and user satisfaction.
Who knows if in the end, the Embedded Analytics platform you have chosen meets all the requirements of your users, data management, customization, interactivity and integration with your software.
Pros and cons of each option
Deciding whether to build a data analytics solution in-house or purchase an integrated analytics solution is an important consideration. Both options have their own pros and cons.
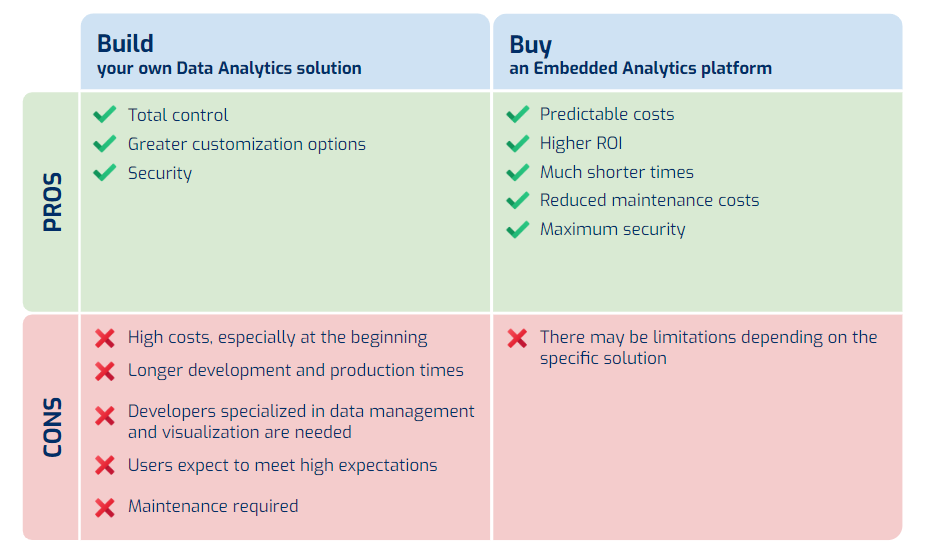
In-house development:
PROS:
- Customization: the creation of an internal solution allows you to adapt the different dashboards or analysis panels to your specific business needs. You have full control over the design, features and functionality.
- Integration: you can seamlessly integrate the data analytics solution with your existing software, ensuring data consistency and real-time updates.
- Data security: you have full control over data security measures, which can be crucial when dealing with sensitive data.
- Scalability: you can scale and expand the solution as your business grows and your analytics requirements evolve.
- Cost control: while initial development and maintenance costs are comparatively significantly higher than using a specialized Embedded Analytics tool, you have greater control over long-term costs and can avoid the subscription fees associated with third-party solutions.
CONS:
- High costs: especially at the beginning, although we must not forget the costs of each necessary modification. You may think at first that “renting” software may seem like a waste of money. "Why continually pay for a license when we can build and own it ourselves?" Do not underestimate the investment that goes into creating and maintaining data analysis software. Making a hypothetical calculation in which a developer expert in data analysis is hired and let's say that 6 months are dedicated to creating a complete analysis module (if all goes well), with an average annual salary of $100,000, you will have to pay at least $50,000 even before having a usable analysis component ready (depends on salary levels in each country). Obviously, the amount of work required will vary from project to project. It's not uncommon to have some complex requirements or for some issues to arise, so those 6 months can easily turn into 1 year. And once you get started, there will be no going back on that initial investment, so don't forget the costs after the initial setup. You must allow time for support, maintenance, and necessary updates or customizations. If you really want to create a good data analytics offering, prepare to hire a team of data engineers for implementation and support. So, roughly figure out how to pay 1-2 full-time employees to keep the dashboards up and running. Continuing with the previous example, this will easily cost at least $200,000 per year. The larger your team, the higher the cost.
- Development time: creating a custom solution can take a long time, which could delay the availability of analytics dashboards to users.
- Resource intensive: requires a dedicated team of developers, data engineers, and designers, which can be expensive.
- Maintenance and Support: you will be responsible for ongoing maintenance, updates, and issue resolution, which may divert resources from other important tasks.
Buy an Embedded Analytics solution:
PROS:
- Speed to market: Embedded Analytics solutions are typically out-of-the-box and can be quickly integrated into existing software, reducing development time.
- Expertise: leverage the expertise of the third-party provider and benefit from their experience in creating effective analytics dashboards.
- Cost savings: initial and maintenance costs are lower compared to in-house construction as significant development costs are avoided.
- Support and Updates: most vendors offer ongoing support, maintenance, and regular updates, reducing the burden on your internal team.
CONS:
- Limited customization: Embedded Analytics platforms may have limitations in terms of customization and may not fully fit your specific requirements. It depends a lot on the tool and your requirements, especially at the level of custom styles.
- Integration challenges: integration with your existing software may not be as seamless as would be desirable and data synchronization may be a concern. It also depends on the integration and data management characteristics carried out by the Embedded Analytics platform.
- Subscription costs: over time, subscription fees for third-party solutions can add up and become a significant expense. As we already mentioned in the guide for B2B SaaS companies, one of the challenges is avoiding unpredictable prices. Obviously it will be more expensive to serve 1,000 users than 50, but you must have clear rules to know how much the service will cost and an approach for increasing the price for your users for having advanced data analytics.
- Data privacy: You will need to ensure that the third-party solution meets your data privacy and security standards.
Ultimately, the decision depends on your company's specific needs, budget, and schedule. You can also consider hybrid approaches, where you start with a third-party solution for rapid implementation, evaluating the customization, interactivity and two-way integration capabilities between both applications, your application and the Embedded Analytics tool. If over time a requirement falls short of the necessary level of customization, you should be able to gradually create a custom solution that coexists with the Embedded Analytics tool as your business grows and requires more advanced features and customization. A careful evaluation of the requirements and a cost-benefit analysis can help you make an informed decision.
Why buying an Embedded Analytics tool is better
At Biuwer, our recommendation is to opt for an Embedded Analytics platform as soon as possible, given the advantages, economies of scale and increasingly customizable solutions to different visual and end-user requirements.
In the end, using an Embedded Analytics platform has a series of implicit advantages that have not been named, but that you can already sense. You have a company with logistics software and you surely want it to be the best logistics software in the world, so you must make the right decision that allows you to:
- Keep the focus on your main product.
- Avoid wasting time on technical maintenance.
- Have a data analytics solution that can evolve in terms of speed and quality at the same time as your product.
- Take advantage of the benefits of continuous innovation, for example with innovative functionalities such as smart data alerts, notifications in various white label formats (your logo, your design, your brand), KPIs with predictive analysis, etc.
About Biuwer
BIUWER is an Embedded Analytics platform that allows software companies to build professional data visualizations within their applications, in a faster, safer and easier-to-use way.
The platform is focused on data-driven decision making, it has been designed to allow easy integration into your applications. So users can access real-time information and create interactive dashboards anywhere and from any device.
In addition, with the use of our software:
- You can deliver data through Embedded Analytics to hundreds or thousands of users with a contained monthly or annual investment, with high ROI.
- Ease of use, as it is a no-code tool, technical or programming knowledge is not necessary.
- It easily integrates with your own software, saving you a lot of time creating and maintaining data visualizations.
- Applies access control to the content and the data itself. We apply end-to-end encryption.
If you need more personalized information or in accordance with your company, you can contact us. Our team will be delighted to assist you.